IC Markets Home Sign in Web Trader Contact Us
IC Markets Social IC Markets Social

Information Hub for
Serious Traders

  • ABOUT US
  • OPEN LIVE ACCOUNT
  • OPEN DEMO ACCOUNT
  • TRADE NOW
  • VISIT OUR BLOG
IC Markets Social
  • ABOUT US
  • OPEN LIVE ACCOUNT
  • OPEN DEMO ACCOUNT
  • TRADE NOW
  • VISIT OUR BLOG
May 30, 2022North_American_Stocks_esIC Markets

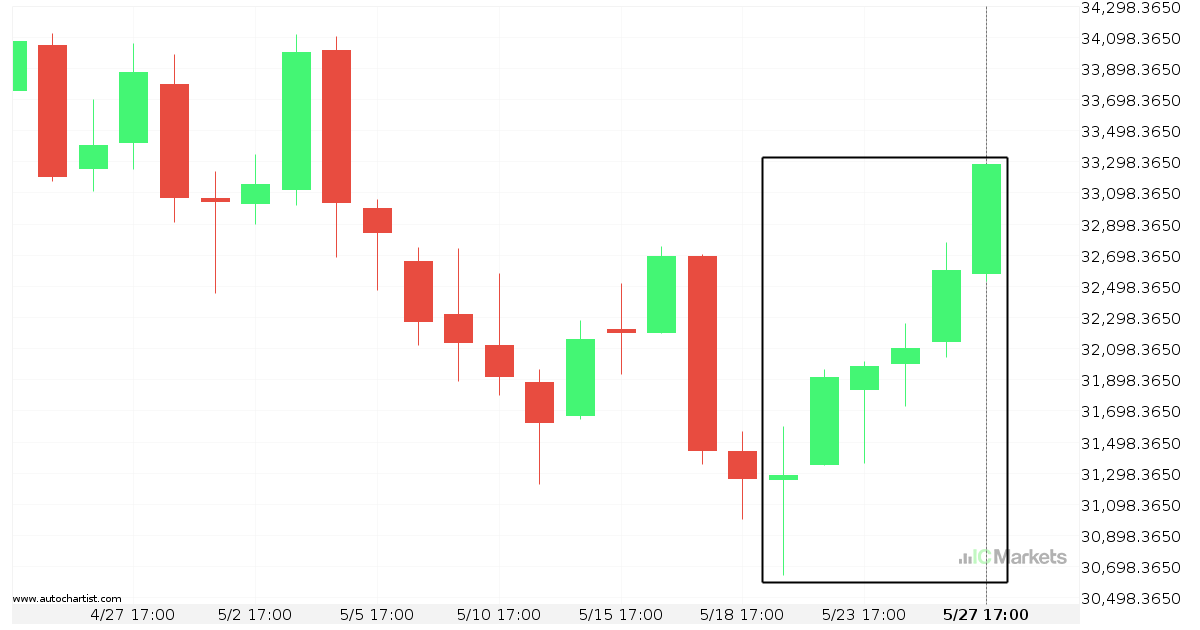
El US Wall Street 30 Index experimentó un movimiento excepcional

Sin importar su estilo de trading, no pierda de vista a US Wall Street 30 Index después de un excepcional movimiento de un 6,33%. Este movimiento ha ocurrido durante los últimos 9 días.

Read more
May 27, 2022North_American_Stocks_esIC Markets

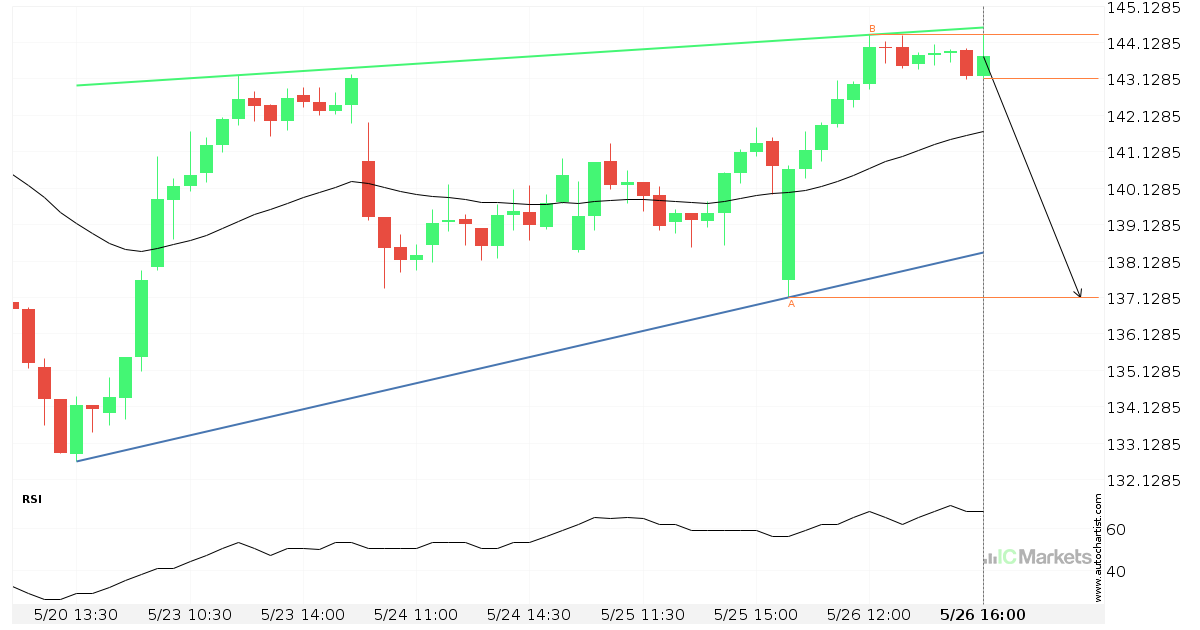
¿Tendrá el Apple Inc. suficiente impulso como para irrumpir el soporte?

El Apple Inc. se dirige hacia la línea de soporte de un Cuña ascendente y puede alcanzar este punto en las próximas 9 horas. Ha probado esta línea ya en numerosas ocasiones en el pasado, y esta vez no tendría porqué ser diferente y terminar con una recuperación en lugar de una irrupción. Si ésta […]

Read more
May 26, 2022North_American_Stocks_esIC Markets

Posible ruptura del nivel de soporte en el US Tech 100 Index

El US Tech 100 Index avanza hacia la línea de soporte de un Banderín, que ya ha probado varias veces en el pasado. Hemos visto un retroceso antes desde esta línea, así que en esta etapa no está claro si atravesará esta línea o se recuperará como lo ha hecho anteriormente. Si el US Tech […]

Read more
May 25, 2022North_American_Stocks_esIC Markets

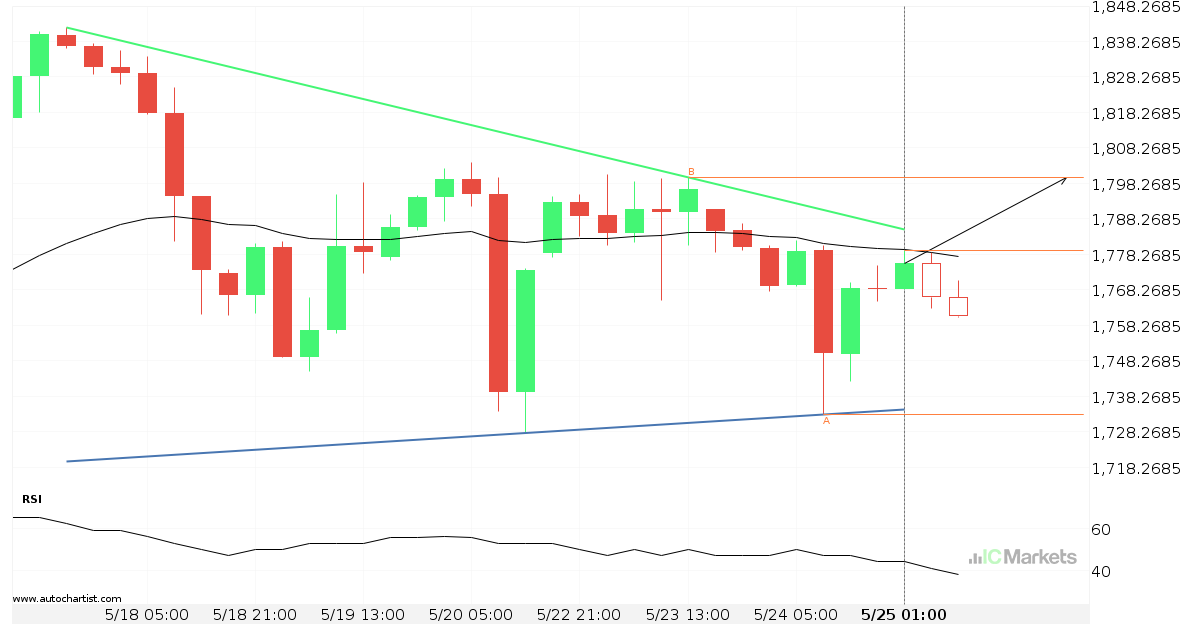
US Small Cap 2000 Index – acercándose a la resistencia del Triángulo

El US Small Cap 2000 Index avanza hacia una línea de resistencia. Como le hemos visto retroceder desde esta línea anteriormente, podríamos presenciar, o bien, una ruptura a través de esta línea o una recuperación a los niveles actuales. Ha llegado a esta línea en numerosas ocasiones en los últimos 8 días y puede probarla […]

Read more
May 24, 2022North_American_Stocks_esIC Markets

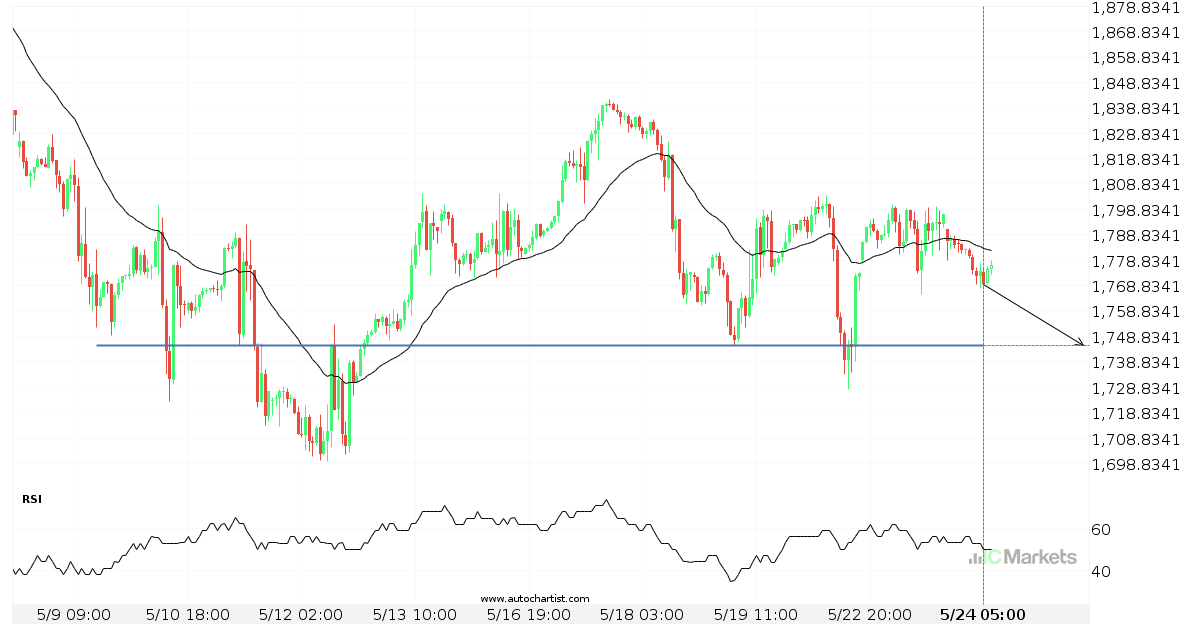
Un posible impulso final en el US Small Cap 2000 Index

El US Small Cap 2000 Index avanza hacia 1745.2400 y podría alcanzar este punto en un plazo de 3 días. Ha probado esta línea previamente en numerosas ocasiones y esta vez no tiene porqué ser diferente, terminando con una recuperación en lugar de en una rotura. Si la rotura no ocurre, podríamos observar un retroceso […]

Read more
May 23, 2022North_American_Stocks_esIC Markets

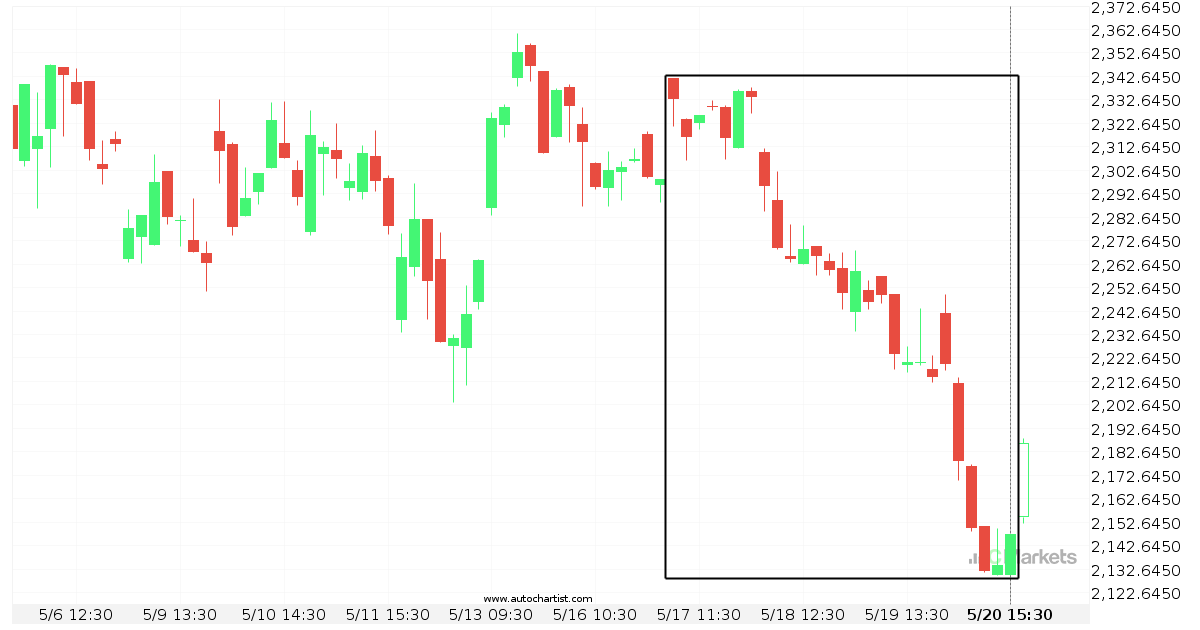
Extraordinario movimiento bajista del ALPHABET INC CLASS C

El ALPHABET INC CLASS C ha descendido un 7,94% de 2.341,73 a 2.147,46 en 4 días.

Read more
May 20, 2022North_American_Stocks_esIC Markets

¿Deberíamos esperar una ruptura o una recuperación del Paypal Holdings Corp?

El movimiento del Paypal Holdings Corp hacia la línea de soporte de un Canal alcista es otra prueba más de la línea que ha alcanzado en numerosas ocasiones durante el pasado. Esta prueba de la línea podría ocurrir en las próximas 8 horas, pero no sabemos si dará como resultado una ruptura a través de […]

Read more
May 19, 2022North_American_Stocks_esIC Markets

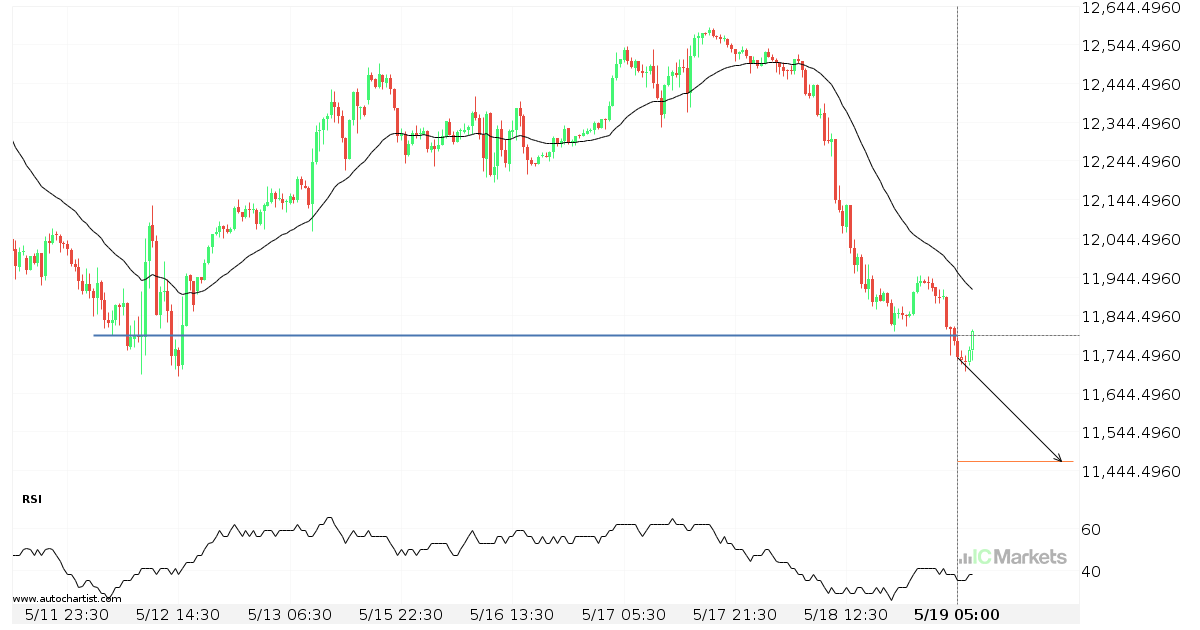
Posible gran movimiento en el US Tech 100 Index

El US Tech 100 Index ha atravesado la línea de 11792.5996, lo cual sugiere un posible movimiento en el nivel de 11468.5801 en las próximas 2 días. Ya ha probado esta línea en numerosas ocasiones durante el pasado, por lo que sería mejor esperar la confirmación de esta ruptura antes de llevar a cabo cualquier […]

Read more
May 17, 2022North_American_Stocks_esIC Markets

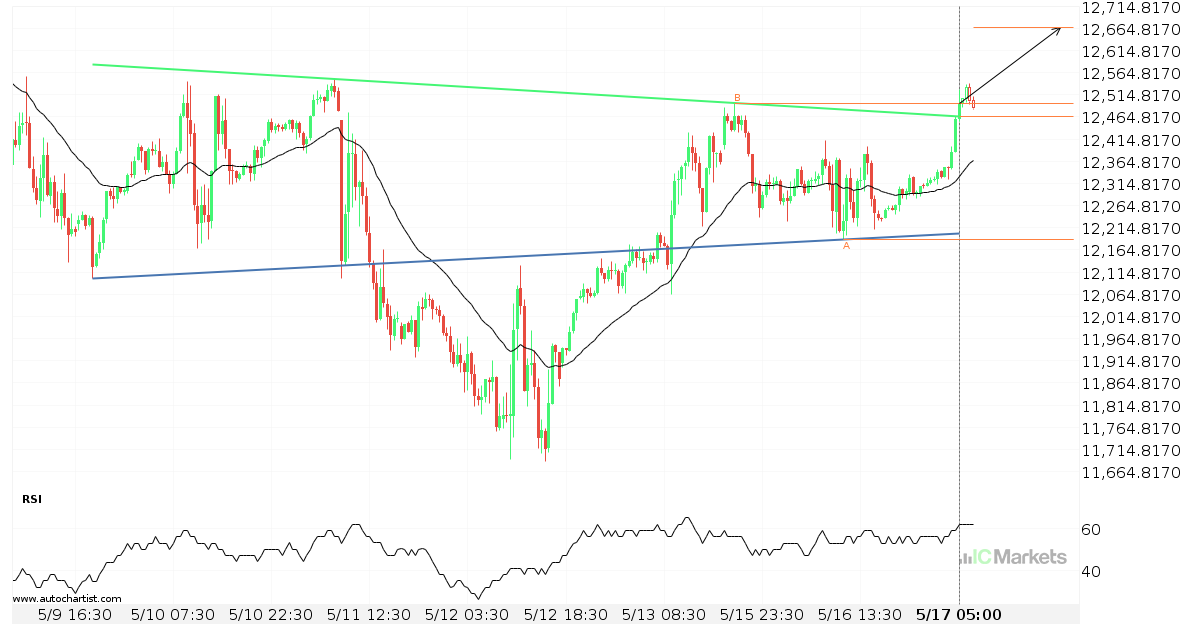
Se espera la posibilidad de un gran movimiento en el US Tech 100 Index

El US Tech 100 Index ha atravesado una línea de resistencia de un Hombro – cabeza – hombro invertido y sugiere un movimiento posible a 12665.9115 dentro de las próximas 2 días. Ya ha probado esta línea en el pasado, por lo que deberíamos esperar la confirmación de esta irrupción antes de entrar en acción. […]

Read more
May 16, 2022North_American_Stocks_esIC Markets

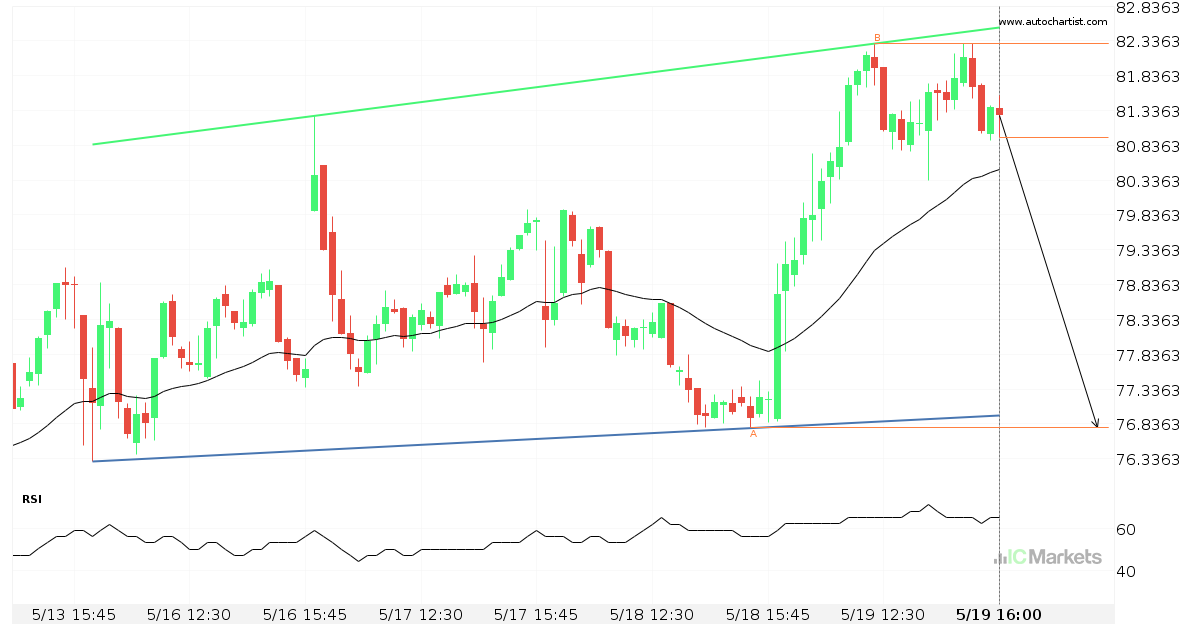
Posible ruptura del nivel de resistencia en el Tesla Inc.

El Tesla Inc. avanza hacia la línea de resistencia de un Canal bajista, que ya ha probado varias veces en el pasado. Hemos visto un retroceso antes desde esta línea, así que en esta etapa no está claro si atravesará esta línea o se recuperará como lo ha hecho anteriormente. Si el Tesla Inc. continúa […]

Read more
  • 1
  • 2
  • 3
  • …
  • 57
  • 58
  • 59
  • 60
  • 61
  • 62
  • 63
  • …
  • 89
  • 90
  • 91

Recent Posts

  • Japan 225 Index approaching resistance level
  • Hong Kong 50 Index – Continuation Chart Pattern – Channel Up
  • AUDJPY – Continuation Chart Pattern – Channel Up
  • Australia 200 Index short term bullish trade setup to 8615.4004
  • Australia 200 Index short term bullish trade setup to 8615.4004

Recent Comments

    Translation


     Edit Translation

    Trade with

    a market leader you can rely on

    Open Trading Account Try a Free Demo

    Forex Trading

    • Accounts Overview
    • Open an Account
    • Launch Web Trader

    Trading Specifications

    • Spreads and Commissions
    • Range of Market
    • Trading Hours
    • Funding
    • Withdrawal

    About IC Markets

    • Help Center
    • Why IC Markets
    • Regulation
    • Legal Documents
    • Contact Us


    Forex Trading

    • Accounts Overview
    • Open an Account
    • Launch Web Trader

    Trading Specifications

    • Spreads and Commissions
    • Range of Market
    • Trading Hours
    • Funding
    • Withdrawal

    About IC Markets

    • Chat with a Specialist 24/7
    • Why IC Markets
    • Regulation
    • Legal Documents
    • Contact Us

    Disclaimer: This material is marketing material where all marketing material is published for informational purposes only. This material does not contain and should not be considered as containing - investment advice and recommendations, or suggestions for performing any actions with financial instruments. The built-in widgets belong to their external independent authors, and IC Markets is not responsible for their content and their impact on trade.

    All content rights reserved. Opinions of the authors may not coincide with the opinion of the blog editors. When copying materials from this site or connecting to an RSS feed to republish our articles, a link to IC Markets or attribution in the format ‘IC Markets Blog’ is required. For general questions, please contact the editorial office via the form on the Contact us page.

    Risk Warning: Trading Derivatives carries a high level of risk to your capital and you should only trade with money you can afford to lose. Trading Derivatives may not be suitable for all investors, so please ensure that you fully understand the risks involved and seek independent advice if necessary. A Product Disclosure Statement (PDS) should be considered before entering into a transaction with us.

    The contents of this page are general information only and does not take into account your personal situation, financial objectives or needs. It is up to you to make sure the products that we offer suit your specific needs. You should not trade with us unless you understand the features and risks of the products that we offer. This means that you might need to seek independent advice before you start trading with us.

    © 2022 Raw Trading Ltd | All rights reserved.
    • Sample Page